
Customer Churn Prediction
Businesses lose roughly $1.6 trillion annually to customer churn. In most industries, up to a quarter of customers churn each year. Increasing customer retention by 5% can increase ROI from 25-95%.
- ~$300K Expected Savings due to Churn Prediction Model
- 30.4% increase in bottom-line
- 7% improvement in customer retention among Fortune 500 companies, SMBs, and, startups
- 91% accuracy in predicting customer churn
Business Implementation
The churn rate is a critical metric of customer satisfaction. According to Forbes, it takes more money (up to five times more) to get new customers than to keep the ones you already have. A low rate of monthly/quarterly churn increases over time. 1% monthly churn can quickly translate to nearly 12% annual churn. Lower churn rates represent happy customers; higher churn rates suggest customers are leaving you.
Some essential leading indicators for customer churn include
- Reduced amount of time spent on the site (known as abandonment)
- An inflated number of lapsed payments
- Repeat purchase ratio, product return rate, and time between purchases
- Number of customers who downgrade services
- Decrease in support tickets submitted to customer service channels
- Price point dissatisfaction and competition defection (using Customer data, Session data, Transaction data
- NPS, loyal customer rate, and customer lifetime value
Churn is a good indicator of growth potential. Churn rates track lost customers, and growth rates follow new customers—corresponding and analyzing both metrics tells you exactly how much one's business is growing over time. You can say your business is growing if growth is higher than churn. If churn is more elevated than growth, your company is not growing.
Our Approach
The customer is king! That's the motto for every sales and consulting team around the world.
While account managers will always be at the heart of any customer relationship, AI provides them with the data they need to make well-informed decisions that help maximize renewals. With granular analysis and insights into the health of each customer, account managers/consultants can proactively focus on developing relationships with customers at an increased risk of churn and construct ways to reposition the engagement/interactions for retention success. Our AI-Blueprint will use your data to predict which customers will churn in their upcoming renewal and offer the top statistical reasons behind each prediction.
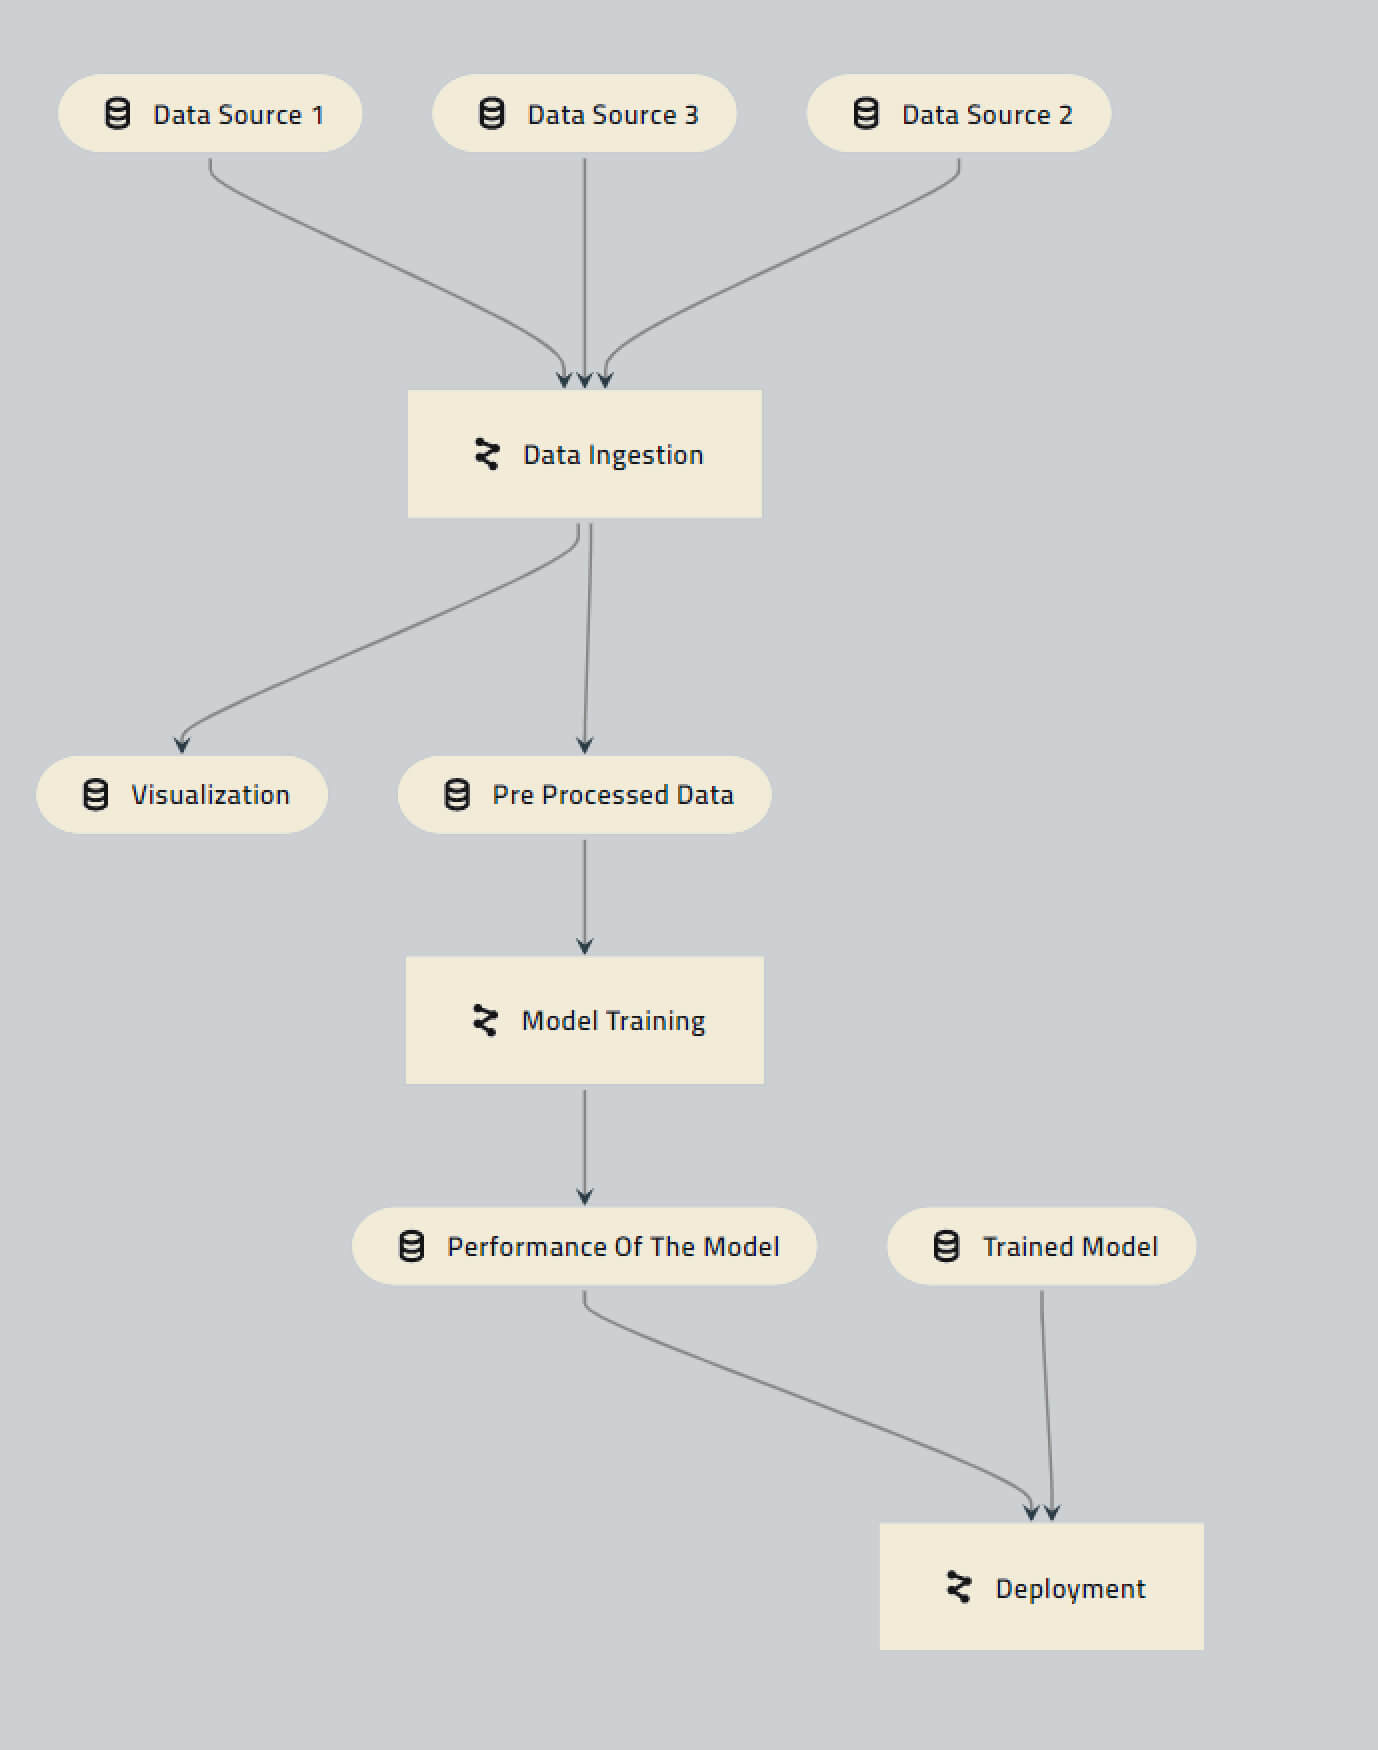
Data from various sources, corresponding to customers successfully retained or otherwise is leveraged to find the relationships between the data and the Target Variable (risk of churn). Post training, given the data corresponding to a customer, the AI, with a certain degree of confidence (probability), can predict if that customer is at risk of churn.
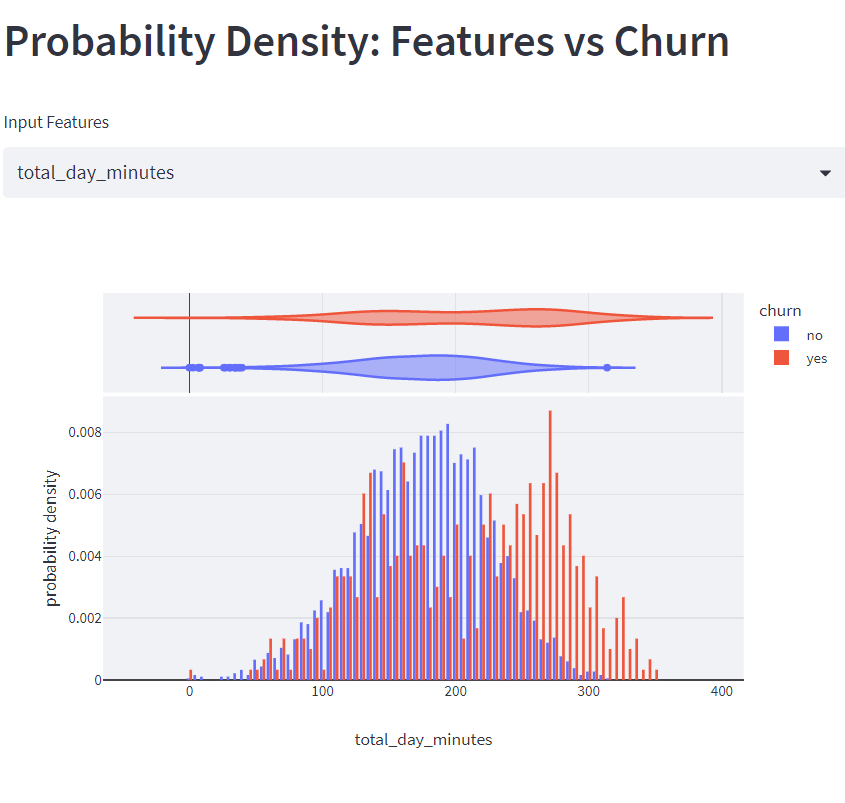
The graph above is a sample of one of our data visualization practices. It depicts the relationship between one of the input features (total_day_minutes) and the target variable (Churn) in data collected for churn prediction in the telecom industry. It suggests that the probability of customer churn is higher when their daily usage is between 130 to 150 or 250 to 300 minutes.
Features of Our Blueprint
Birds Eye View into Customer Health
Integrate first- and third-party data for a real-time, 360-degree view of the consumer that identifies the unique highest-value opportunities and experiences for each.
KPI Attribution platform
Attribute the impact of every interaction leading to a sale or other desired KPI and optimize across channels, audiences, and products to maximize ROI.
Personalization engine
Generate and scale hyper-personalized insights to enable analytics, predictions, and insights in real-time across channels.
AI-powered Blueprint for free
Predict customer value and identify and offer the best action to increase cross-sell/upsell, boost revenue, and improve customer satisfaction in real-time.
Tech Implementation
Understanding the Data
The objective is to predict if an existing customer is going to churn. Accordingly, the feature/variable of interest (‘Target Variable’) is ‘churn’. We’ll use a synthetic dataset with data that represents the behavior patterns of customers across the United States, corresponding to churn prediction in the Telecom industry. The features (columns) of this dataset are minimal and can easily be collected. In this dataset, we have a total of 4250 samples and 20 input features/variables.
.jpg)
Input Features
.jpg)
Setting up the Training
It is apparent that the data we have is imbalanced, which is typically the case with churn prediction-type applications. We have about 6 negative churn samples to 1 positive churn sample. To address this class imbalance in the data, we make use of the Synthetic Minority Oversampling TEchnique (SMOTE). SMOTE scales the minority class, therefore, providing us with more data to work with for the minority class (positive churn), which thereby increases the quality of the predictions.
Customization made easy
When it comes to model training, we train various models spanning something as simple as logistic regression to something as sophisticated as a neural network, all while varying the hyperparameters of the models, so you don't have to worry if you are using the right model for the job. We operate in a completely transparent manner making sure that there are no black boxes throughout the blueprint. We make use of open-source libraries and frameworks so that you can easily modify, replace and optimize for much more customization should you need it. Thanks to our transparent approach, you can get your hands dirty by playing around with the hyperparameters should you feel the need for experimentation. The performance of the models corresponding to different sets of hyperparameters is saved so you don’t need to make a note every time you intend to tweak the models.
Model Selection and Evaluation Metrics
If you have a look at the data points corresponding to each label (churn: yes/no) it is very apparent that we have a huge imbalance between the labels. In scenarios like these, accuracy and precision are often very high and tend to be uninformative because of the abundance of the negative churn class, and this also serves as a good motivation to employ recall as our primary evaluation metric as it allows us to focus more on the positive churn class thereby improving the quality of predictions.
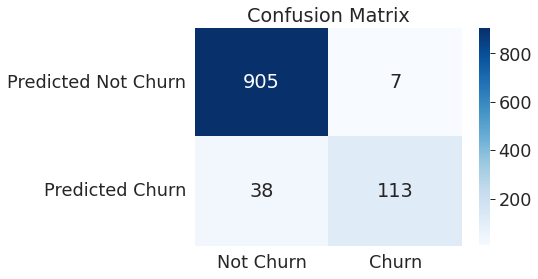
From the Confusion Matrix, it can be interpreted that the number of customers that ACTUALLY might churn but are predicted otherwise by the model is 7. The Hyperparameters of the model can be further fine-tuned to reduce this number.
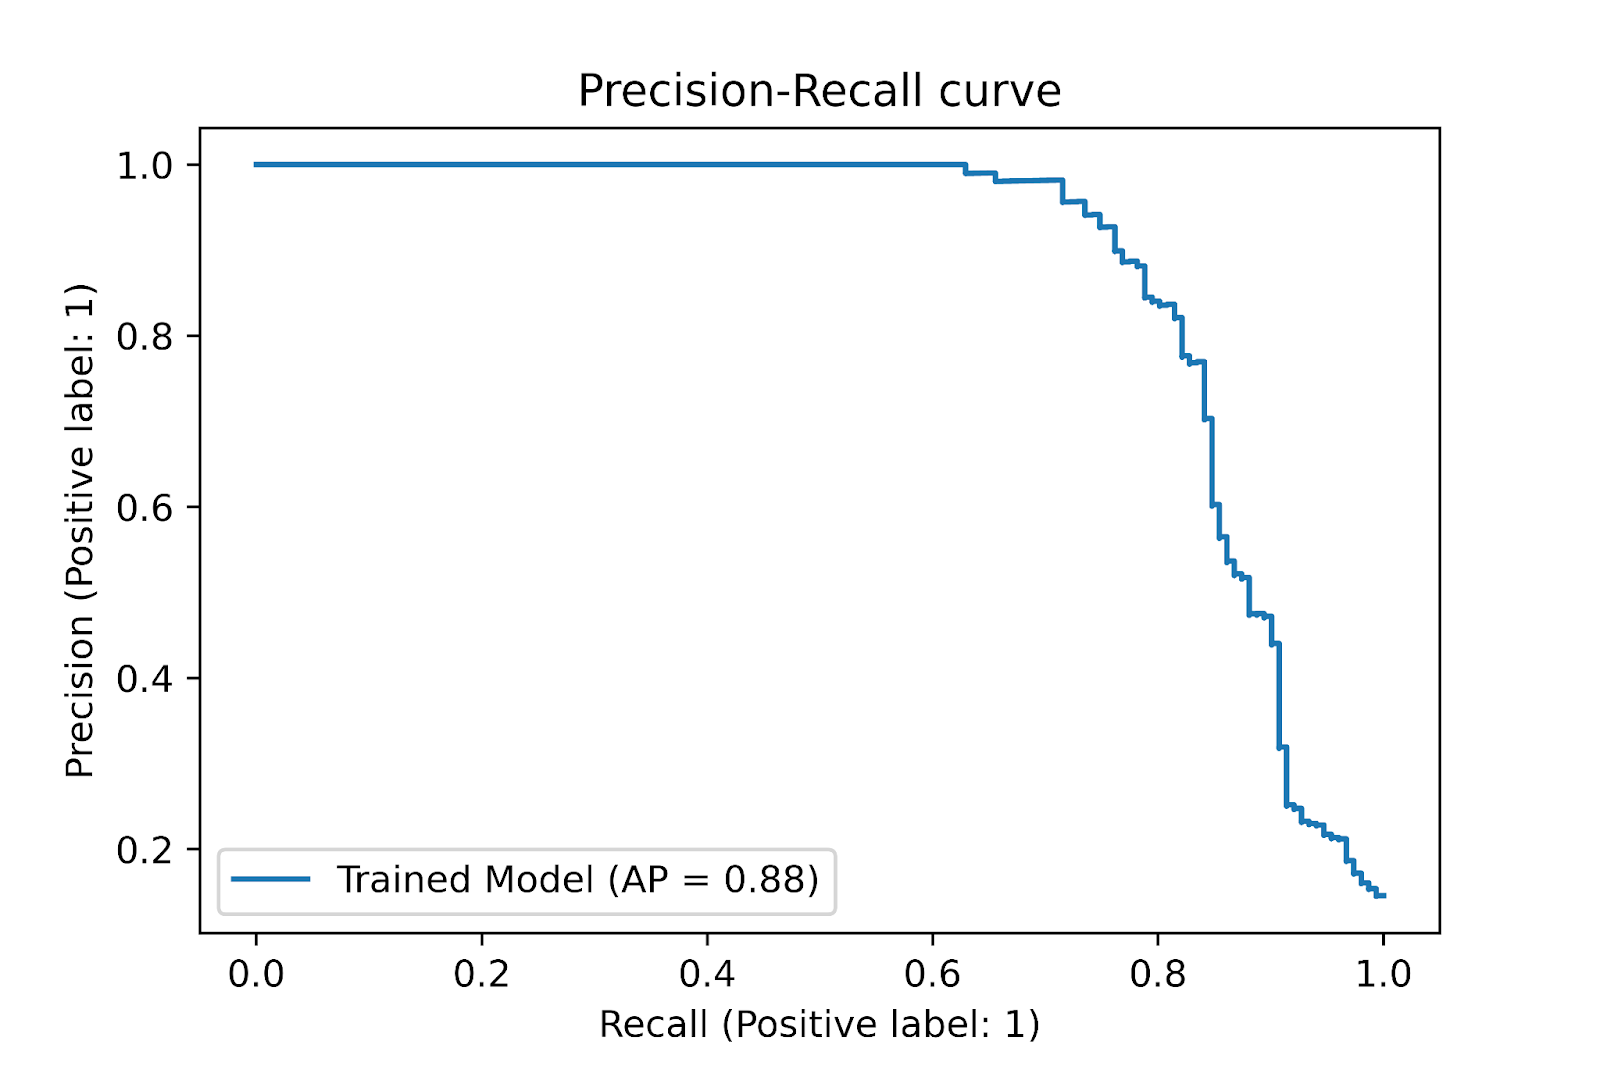
Since there’s a class imbalance in our data, a precision-recall curve serves as a good metric to evaluate the performance of the model.
The Model’s perspective:
It is important to understand what led the model to arrive at a certain prediction. Technically referred to as Model Explainability, it is an important phase in the MLOps cycle that is generally overlooked.
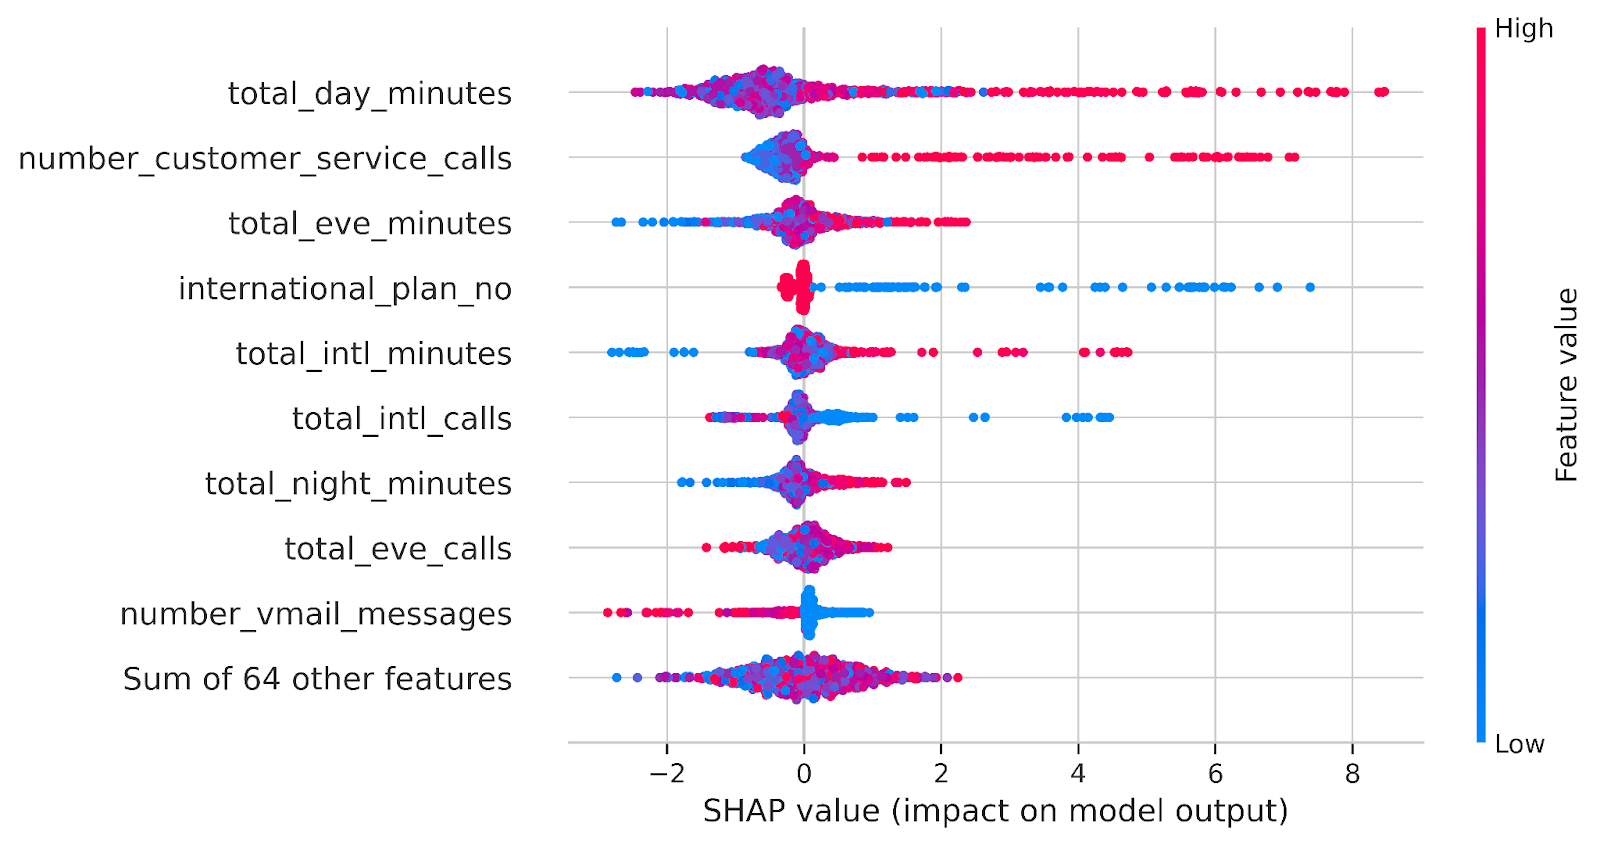
For this example, we’ve used an open-source library ‘SHAP’ to demonstrate a glimpse of Model Explainability. The plot describes the effect of each feature on the prediction. Total_day_minutes has had the most impact, followed by number_customer_service_calls, and international_plan. Larger SHAPley values, both positive and negative, have larger impacts on the predictions.
The Last Mile
We now have the model ready, and the next big step is to take it live. Model Monitoring and Responsibility are things that are often overlooked. Models in production come with their own set of challenges some noteworthy ones are model drift and data drift. It is also important to make sure that the models are responsible, that is, the prediction of the models shouldn’t biased to sensitive elements such as race, and gender. Our blueprint is further integrated with Censius- a platform for end-to-end AI Observability.
Case Study
Explore other AI Blueprints


Request a blueprint demo
Our AI Blueprint helps you adopt AI into business. Discover the power of our AI with a personalized blueprint demo.
Get started today and explore the potential of our AI blueprints. Sign up now!