
Customer Segmentation
Customer segmentation allows a business to personalize its relationships with customers, as we do in our daily lives. 77% of marketing ROI comes from segmented, targeted, and triggered campaigns.
- ~$100k Expected Savings due
- 16% increase in bottom line,
- 3% improvement in customer retention
- 90% improvement in engagement for Targeted Ads
Business Implementation
Customer segmentation implies grouping customers according to diverse factors. When an organization conducts customer segmentation, they find similar traits/attributes in each customer's behavior and requirements. Then, they are generalized into levels to satisfy demands with diverse strategies. These techniques can be an input of
- Targeted marketing activities to specific groups
- Launch of features aligning with the customer demand
- Development of the product (old/new) roadmap
- Improvement of NPS scores for companies
Customer segments are unlimited and rely mainly on how much customer data one has that can be used. Various customer segmentation methods largely depend on four parameters:
- Geographic customer segmentation is straightforward; it's about the user's location. You can group by country, state, city, or zip code.
- Demographic segmentation relates to customers' structure, size, and movements over space and time. Many companies use gender differences to create and market products. Companies also use web traffic for advertising products based on customer preferences.
- Behavioral customer segmentation is based on past observed behaviors of customers that can be utilized to expect future actions.
- Customer psychological segmentation generally deals with personality traits, attitudes, or beliefs, which can be obtained through customer surveys.
Enforcing customer segmentation leads to plenty of new business possibilities. Companies can optimize in:
- ROI
- product design
- product promotion
- marketing and sales,
- customer satisfaction
With Attri's AI Blueprint for hyper-segmentation, free up your time to focus on more demanding problems that require creativity. With the ease of retraining, companies can use the old model of our blueprint as the starting point and retrain it. They can also retain the existing model and combine its output with a new model. With higher accuracy and better scaling, our blueprints are flexible for future modifications and feedback.
Tech Implementation
Understanding the Data
The motivation behind Customer Segmentation is to identify the underlying patterns in customer behavior and segregate the customers into groups based on these discovered patterns. We’ll be using a synthetic dataset with about 2000+ samples corresponding to a company’s customer behavior over a period of 2 years.
Setting up the training
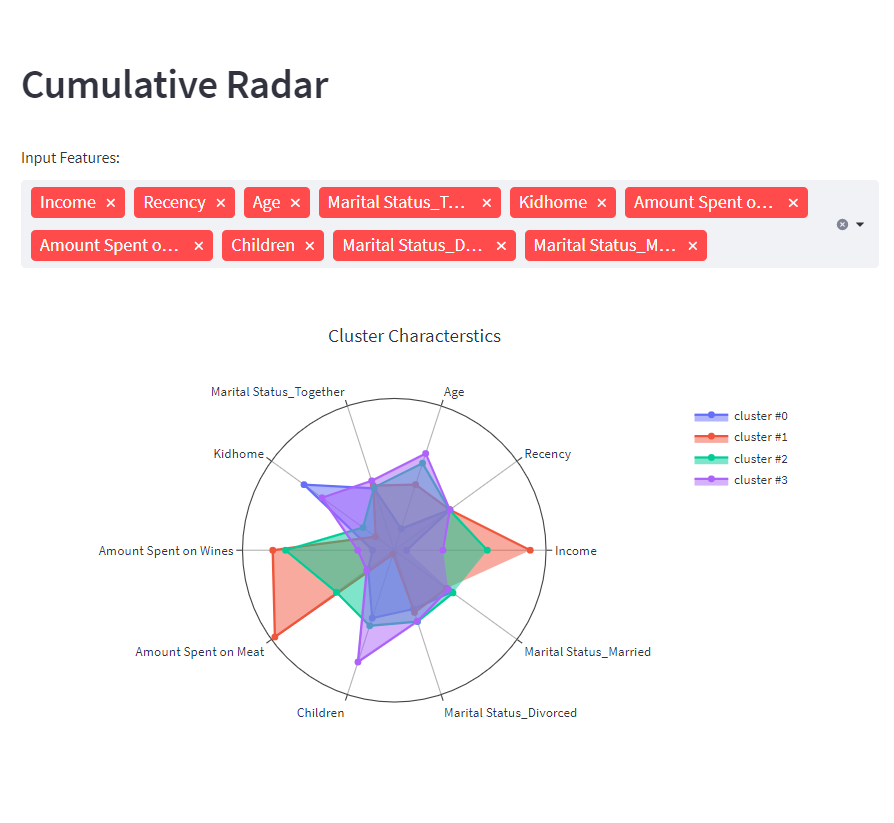
First up, we search the data for outliers to remove them after careful consideration, followed by the standard data pre-processing. The data we’re working with has around 19 input features, which implies we have 19 dimensions to our data. On top of these input features, we engineer more features to provide more context and interpretability. This introduces additional dimensions- increasing the complexity of the data. During the training phase, to mitigate this complexity, we reduce the dimensionality of our data to a smaller number by performing Principal Component Analysis.
Customization made easy
Typically, the Data available for such applications does not come with labels (a data point indicating which customer belongs to which group) which is why we turn to Unsupervised Machine Learning Algorithms. When it comes to model training, we train various models spanning something as simple as K means to something as sophisticated as a neural network, all while varying the hyperparameters of the models, so you don't have to worry if you are using the right model for the job. We operate in a completely transparent manner making sure that there are no black boxes throughout the blueprint. We make use of open-source libraries and frameworks so that you can easily modify, replace and optimize for much more customization should you need it. Thanks to our transparent approach, you can get your hands dirty by playing around with the hyperparameters should you need experimentation. The performance of the models corresponding to different sets of hyperparameters is saved so you don’t need to make a note every time you intend to tweak the models.
Evaluation Metrics
Evaluating a model trained in an unsupervised manner is generally not very straightforward. How would you evaluate a model when you don’t know what the ground truth is? In scenarios like this accuracy, precision or recall are not possible to compute. We turn to advanced statistics for a solution.
Silhouette score: Defined between -1 to 1, the Silhouette score describes the quality of the clusters. The higher, the better.
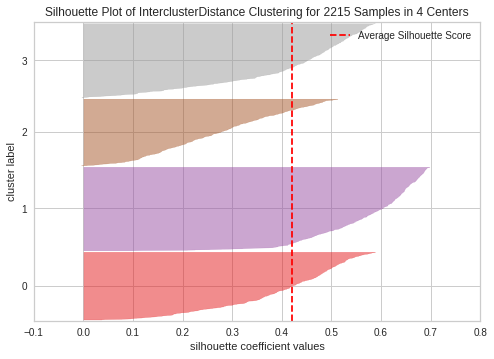
Davies-Bouldin Index: The Davies-Bouldin Index defines the similarity between the clusters, implicitly describing the quality of the separation between the clusters. Starting from 0, the lower the value the ideal the model.
Davies-Boulding Index for the current model: 2.423206966611747
The Model’s perspective
Being able to understand the reasons behind the predictions/decisions the models take is important especially if it’s in a business context. To explain the features that are predominant in each cluster, for this example, we employ an open-source library SHAP.
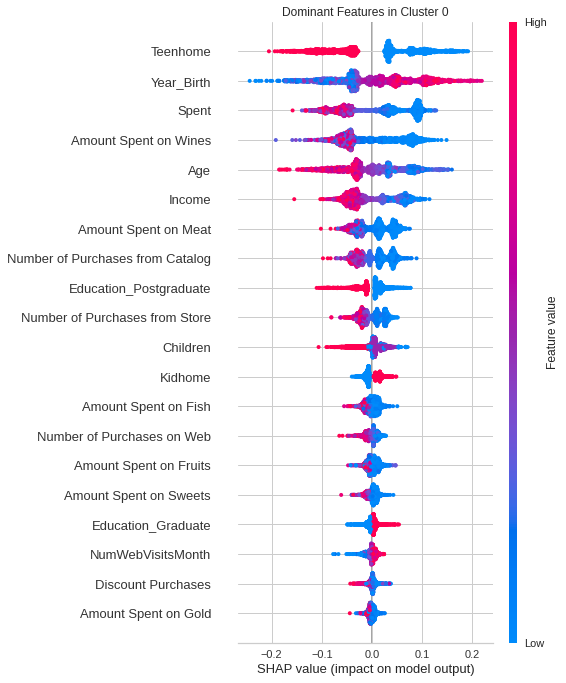
The SHAP plot describes the impact each feature has on Cluster 0, which is the first of 4 clusters our model generated. The features are sorted by their impact, so intuitively, the features with the most impact on Cluster 0 are ‘teenhome’, ‘Year_Birth’, and ‘Spent’. This analogy extends to the other clusters as well.
The Last Mile
We now have the model ready, and the next big step is to take it live. Model Monitoring and Responsibility are things that are often overlooked. Models in production come with their own set of challenges some noteworthy ones are model drift and data drift. It is also important to make sure that the models are responsible, that is, the prediction of the models shouldn’t biased to sensitive elements such as race, and gender. Our blueprints are further integrated with Censius- a platform for end-to-end AI Observability.
Case Study
Explore other AI Blueprints


Request a blueprint demo
Our AI Blueprint helps you adopt AI into business. Discover the power of our AI with a personalized blueprint demo.
Get started today and explore the potential of our AI blueprints. Sign up now!