
Demand Forcasting
A precise forecasting model is not satisfactory enough. An organization needs a useful one.
- 91% accuracy in forecasting demand and supply across multiple channels
- 5%-25% in ROI across multiple industries
- 2.5x In productivity achieved without any addition of personnel
Business Implementation
What is the top pain point for most business executives? Too many factors — from weather fluctuations to posts by social media influencers or political instability — impact buyers, causing them to change their minds frequently. Gartner, the world's largest IT research firm, gives a clear answer: demand volatility.
Demand forecasting is a specialization of predictive analytics, which is the method of estimating consumer/customer demand forecasts by analyzing historical and documented data. Organizations use demand forecasting methods to evade inefficiencies caused by the misalignment of the supply and demand market across enterprise operations. With demand forecasting techniques, businesses can enhance their decision-making processes regarding cash flow, risk assessment, capacity design, and workforce planning.
Machine Learning models won’t make your demand planning team obsolete — but they might reduce their workload.
Usually, machine learning models beat state-of-the-art forecasting software by 5 to 15%. Better accuracy can be achieved as more data is available (demand drivers).
Demand Forecasting to Enhance Decision-Making
Organizations makes hundreds — if not thousands — of decisions daily. Supply chains' decisions rely on demand estimates. The demand forecast is, therefore, critical information to make the right judgments.
As the demand forecast triggers specific movements, it should be done at the right aggregation level, tracked with the relevant metrics, and supported by an efficient review process. Regarding demand forecasting, most supply chains rely on populating 18-month forecasts with monthly buckets. An accurate forecast needs to be better.
In short, our AI Blueprint on Demand Forecasting has always been a means to an end, not the end itself. When setting up a forecasting process, Attri focuses on
- Validating the right geographical and material granularity for your forecast.
- The proper period and time bucket.
- Choosing the suitable metrics for a forecasting process/model is explicitly determined. Here are some KPIs: RMSE, MAE, MAPE & Bias, etc.
- An intuitive dashboard to track, manage, analyze and gain insights on future forecasting
Beyond the math, it is essential to align the forecasting KPIs to the required material and timelines.
Once the company determines the decisions they need to make, setting up its forecasting process according to this framework should be easy.
We will show you how you can easily harness the power of the company’s data with Attri, which can:
- Forecast warehouse traffic to plan resources efficiently: Predict which products will be returned and conduct a root cause analysis to prevent avoidable returns.
- Forecast demand for staffing in Retail / DC / Warehouse: Forecast the volume of inbound shipments required over the next month to allocate the correct staffing levels.
- Predict shipment arrival: Foresee and mitigate disruptions to your supply chain by predicting whether shipments will arrive on time.
- Forecasting the need for new products: Forecasting the demand for to-be-launched products enables retailers to optimize inventory, logistics, and working capital and be better prepared to serve their customers.
- Predict whether a parts shortage will occur: Predict part shortages or late shipments in a supply chain network so that businesses can prepare for foreseeable delays and take data-driven corrective action
Some everyday use cases for demand forecasting include manufacturing, travel, airlines, healthcare, automobile, government, retail, etc.
Features of Attri AI Blueprint
Onboard Metrics/KPIs
Connect to real-time and offline data to detect outliers at a massive scale with Attri blueprints
Detect Anomalies
Understand what went wrong by identifying data pattern changes with intelligent alerts through Censius
Fast-Track Problem Solving
Use interactive root-cause analysis to gain insights into the forecast, and what caused it
Tech Implementation
Understanding the Data
Demand forecasting is a typical regression problem. We’ll need historical data to find patterns to help us predict the future. For this example, we’ll be working with synthetic data to simulate the forecasting process. The dataset is pretty basic with close to a million data samples collected over a period of 4 years representing 10 stores containing 50 items each.
.jpg)
Input Features
.jpg)
Setting up the Training
The input features that we have are too simple to discover meaningful patterns using Machine Learning. The numbers on any given day are dependent on a lot of other factors such as the season, day of the week, month of the year, store location, and many more. We try to address this apparent lack of information in the raw input features by processing the raw data and engineering these features from the raw data. Feature Engineering helps build context around the dates which in turn helps the model in discovering the patterns better. Feature engineering is not the only way to go about solving this problem. Depending on the data you’re working with, you could take a more statistical approach to address this problem. Statistical models like ARIMA, PROPHET, SARIMAX are all capable regression models which we don’t overlook.
Customization made easy
When it comes to model training, we train various models spanning something as simple as logistic regression to something as sophisticated as a neural network, all while varying the hyperparameters of the models, so you don't have to worry if you are using the right model for the job. We operate in a completely transparent manner making sure that there are no black boxes throughout the blueprint. We make use of open-source libraries and frameworks so that you can easily modify, replace and optimize for much more customization should you need it. Thanks to our transparent approach, you can get your hands dirty by playing around with the hyperparameters should you feel the need for experimentation. The performance of the models corresponding to different sets of hyperparameters is logged so you don’t need to make a note every time you intend to tweak the models.
Evaluation Metrics
There’re multiple evaluation metrics for regression models. For this example, we consider the following metrics as they provide a fair insight into the model’s performance.
Mean Absolute Error [MAE]: This is the average difference between the actual and the predicted values. [Lower the better]
Mean Absolute Percentage Error [MAPE]: Explains the error in the accuracy of the forecasting. [Lower the better]
Coefficient of determination[R2]: Explains the quality of the predictions on a scale of 0 to 1 with 1 being the perfect score. [Higher the better]
These are the current performance metrics of our model. These can further be improved by tweaking the hyperparameters of the model or by more feature engineering. Note that the performance of the model, or any Machine Learning model for that matter, is dependent on the nature of the dataset being used, it is important to have potent data to produce good results.
MAE: 6.1060702931820465
MAPE: 0.13712715319586544
R2_SCORE: 0.9230799956063259
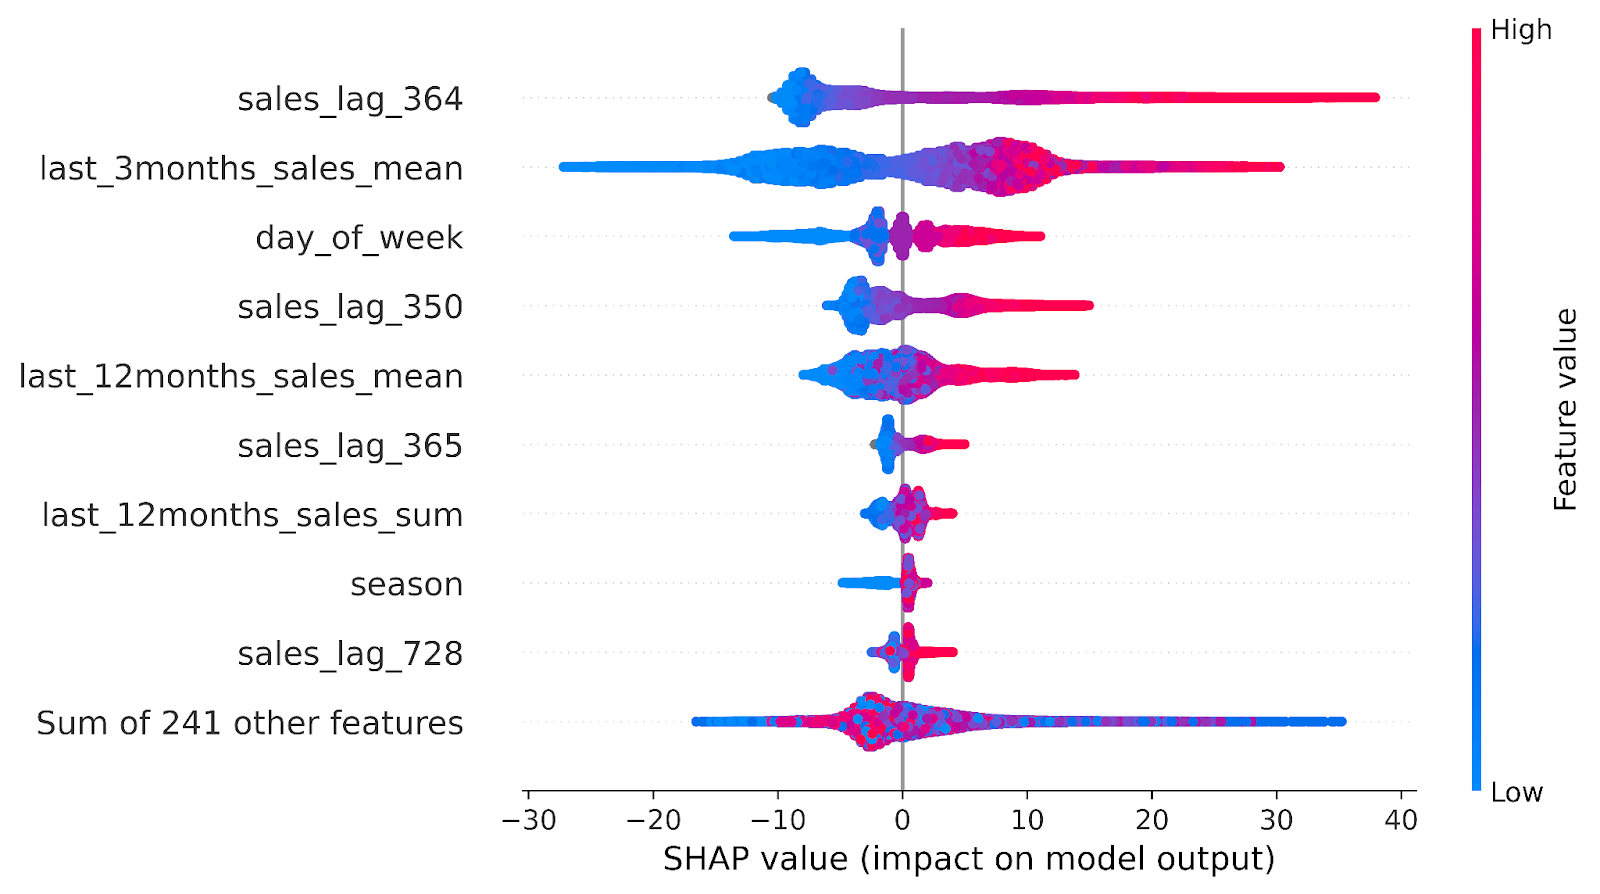
The Model’s perspective:
Model Explainability is one of the most overlooked stages in the MLOps cycle. With the help of model explainability, one can identify the factors/features that influence the predictions of the model. For this example, we employ SHAP. SHAP is an open-source library developed for model explainability. The SHAP plot here depicts the magnitude (both positive and negative) of the impact each feature has on the predictions with the top 3 features being sales_lag_364, last 3 months_sales_mean, and day_of_week followed by others.
The Last Mile
We now have the model ready, and the next big step is to take it live. Model Monitoring and Responsibility are things that are often overlooked. Models in production come with their own set of challenges some noteworthy ones are model drift and data drift. It is also important to make sure that the models are responsible, that is, the prediction of the models shouldn’t biased to sensitive elements such as race, and gender. Our blueprint is further integrated with Censius- a platform for end-to-end AI Observability.
Case Study
Explore other AI Blueprints


Request a blueprint demo
Our AI Blueprint helps you adopt AI into business. Discover the power of our AI with a personalized blueprint demo.
Get started today and explore the potential of our AI blueprints. Sign up now!